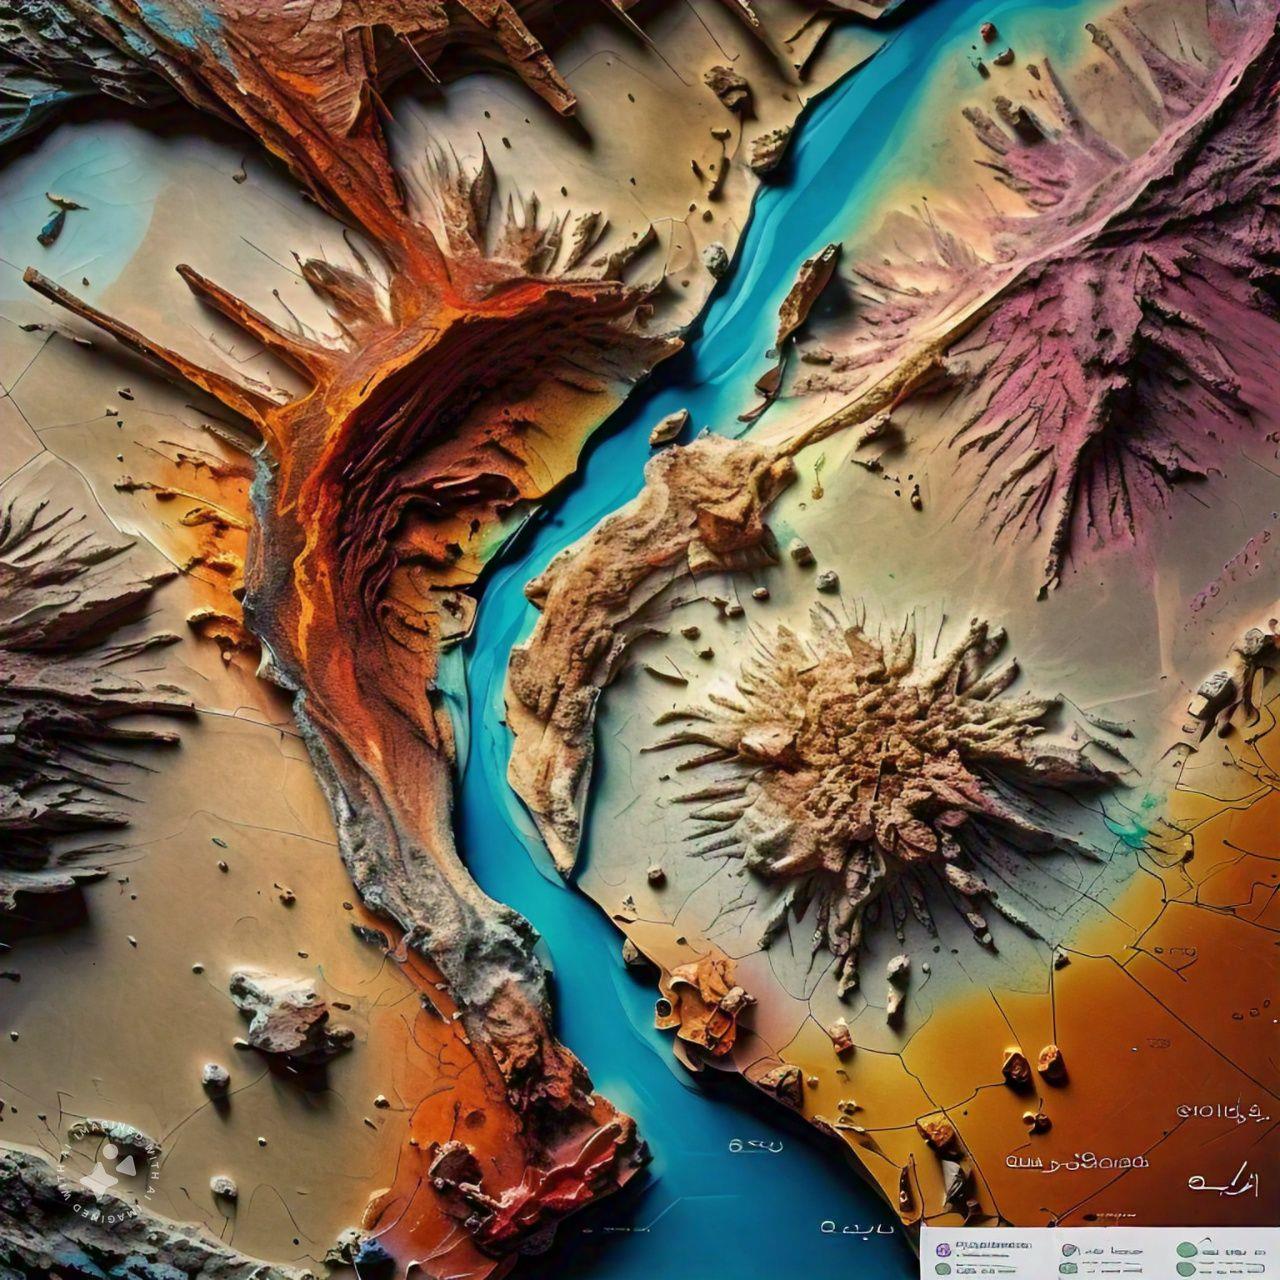
3D Geological Modelling
3D geological modelling builds a digital, three-dimensional representation of the ground from all available data. Borehole logs, geological maps, cross-sections, geophysical results, topographic surveys and laboratory data are compiled into a database and loaded into specialist modelling software. Geologists interpret the surfaces between units, the shape of faults and the distribution of properties, and the software interpolates them into solid volumes. The model can be sliced in any direction, checked against new boreholes and updated as the project develops. It is used to visualise ground conditions, estimate excavation and fill volumes, plan tunnels, foundations and slopes, model ore bodies and communicate geological risk clearly to engineers and decision makers.
Geological Mapping & Analysis
Geological mapping records the types of rock and soil at the surface, where they meet and how they are deformed, and presents this on a map. Geologists walk planned traverses with a topographic base map or satellite image, GNSS receiver, compass-clinometer, hand lens and hammer, describing outcrops, measuring structures and collecting samples. Field data are combined with remote sensing, existing maps and borehole information and digitised in GIS. The analysis produces geological maps, cross-sections and reports that explain the ground conditions. In engineering projects these outputs are used to assess site suitability, identify hazards such as faults, weak layers and cavities, and plan targeted ground investigation.
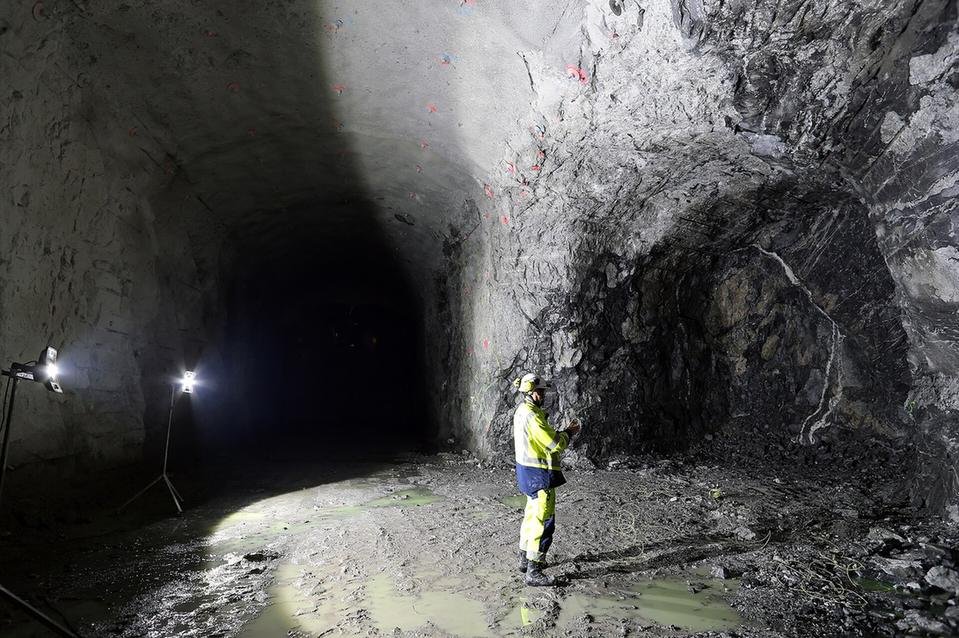
Drill Hole Data Analysis
Drill hole data analysis turns the information collected from boreholes into a reliable picture of the ground. Logs of lithology, weathering, core recovery and RQD are combined with in-situ test results such as SPT, groundwater levels, downhole surveys and laboratory or assay data in a single validated database. Errors, gaps and inconsistencies are checked before the data are used. Geologists and engineers then plot borehole logs and cross-sections, analyse statistics by unit and depth, and identify trends and anomalies. The results support the derivation of design parameters, the building of 3D models and resource estimates, and decisions on whether further drilling is needed.
Stratigraphic Correlation
Stratigraphic correlation matches layers of rock and sediment between separate locations to show how they continue across a site or region. Geologists compare boreholes, outcrops and trenches using rock type, colour, grain size, fossils, distinctive marker beds and the patterns seen on geophysical logs. Matching units are linked on cross-sections and fence diagrams, revealing changes in thickness, layers that pinch out, and offsets caused by faults. Where data are sparse, geophysical sections help fill the gaps between holes. In engineering and exploration projects, correlation underpins the ground model, helps predict conditions between boreholes, guides foundation and tunnel design, and traces aquifers or mineralised horizons.
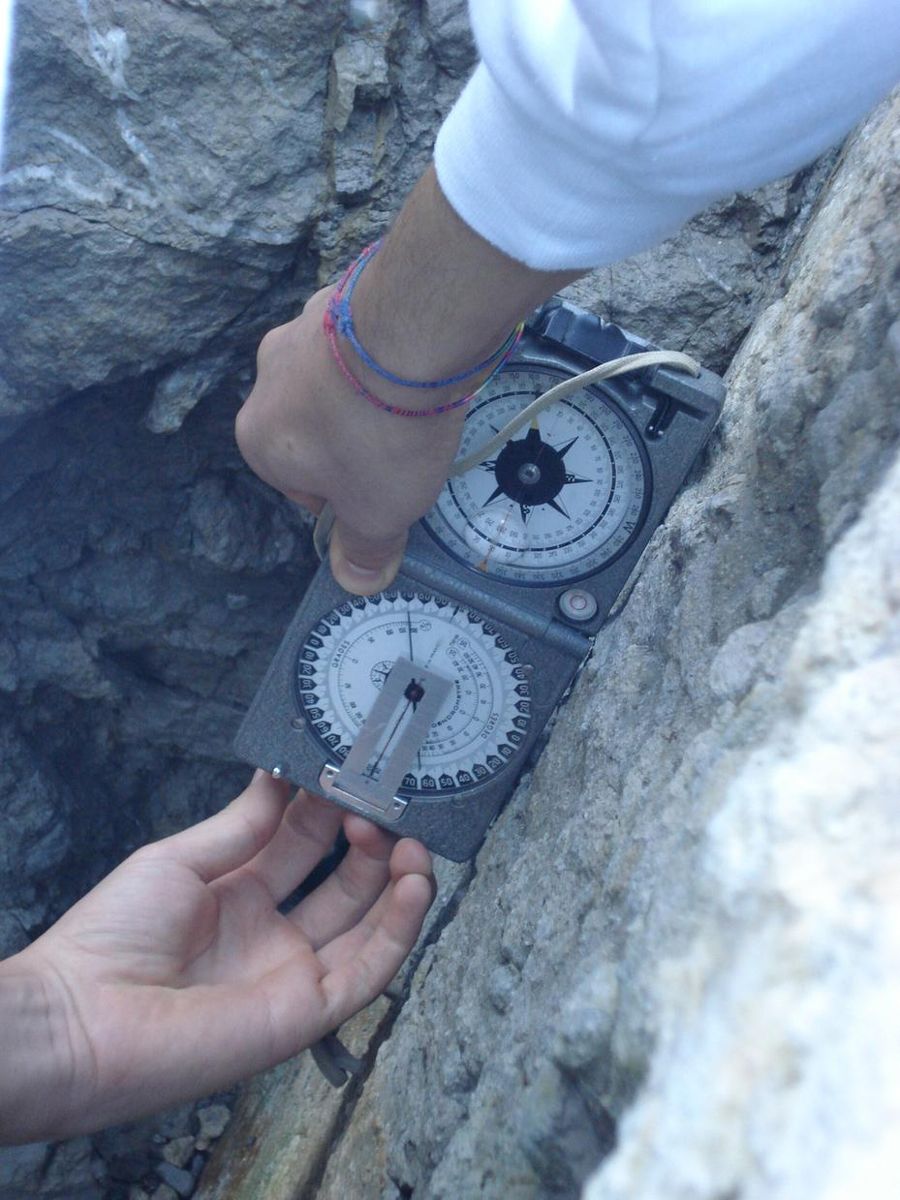
Structural Geology Mapping
Structural geology mapping records the orientation and character of planes and lines in rock, such as bedding, joints, faults, folds and foliation. Geologists measure dip and dip direction with a compass-clinometer at outcrops, in excavations and in oriented core, and note spacing, persistence, roughness, aperture and infill of each discontinuity. Photogrammetry and laser scanning are increasingly used to capture inaccessible faces. The measurements are plotted on stereonets to identify sets of discontinuities and analysed for planar, wedge and toppling failure. The results guide the design of rock cuts and slopes, tunnel support, foundation treatment and quarry benches, and identify faults that may affect a site.
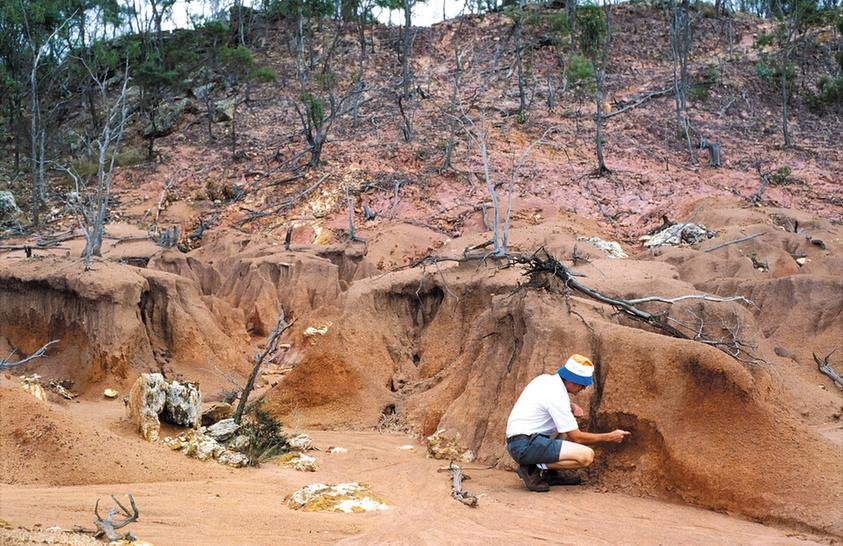
Geomorphological Surveys
Geomorphological surveys map the shape of the land surface and the natural processes that formed it and continue to change it. Using field inspection, aerial and satellite imagery, drone surveys and digital elevation models, geomorphologists identify landforms such as wadis, alluvial fans, sand dunes, sabkha flats, escarpments, gullies and landslide scars, and assess how active they are. Maps classify landforms, materials and processes, highlighting erosion, sediment deposition and drainage paths. In engineering projects these surveys help with route and site selection and identify hazards such as flash flooding, moving sand, slope instability and ground subsidence, informing drainage and protection design.
Other capabilities in this service
Back to Geological Mapping ServicesDiscuss your project with ATLAS GES
Tell us about your site and requirements, and our team will get back to you.
Get in Touch